The following are the steps used to select the crime statistics for Terrytown.
- Go to https://communitycrimemap.com
- Click Filter at the top of the page
- Set the Buffer to 2 miles and click the check box for Only display events within buffer.
- Select the Events (crime categories) to be included. Select all except:
All Other – Non-Criminal
Citation / Summons
Civil / Court Violations
Driving Under the Influence (DUI)
Traffic Incident
The first three are not criminal. The last two are omitted because it is not possible to determine whether changes in the numbers indicate changes in the number of actual incidents or changes in enforcement efforts or a combination of both. - Select the desired Date Range.
When reviewing numbers for a given Date Range, I have found it best to wait 3 – 5 business days after the ending date of that range. There can be a delay in posting the final numbers. It may be a delay on the part of JPSO in reporting the numbers or a delay on the part of Lexis/Nexis in posting them or a combination of the two.
For monthly numbers, I divide the month up into three 8-week segments plus a fourth for the remaining days. Dealing with a smaller number of records at a time makes it easier to count the crimes by category (Step 15) and to identify and eliminate the remaining records for crimes outside Terrytown (Step 16). - Click Apply.
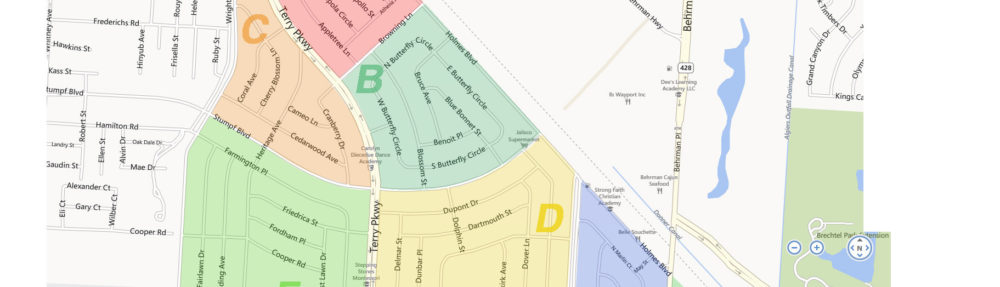
- In the address field, enter 500 Behrman Hwy, Terrytown, LA
then click the magnifying glass icon to apply.
This will include Oakwood at the northern most part of Terrytown and Rouse’s at the southeast corner. It does include a large amount of Algiers. But that will easily be filtered out in Step 10. And it minimizes the amount of Jefferson Parish outside Terrytown. That reduces the number of incidents to be removed from consideration in Step 16.
Note that this step needs to be repeated each time the Filter conditions are changed. In other words, it must be repeated each time Step 6 and any prior steps are repeated. - Check the total number of records returned. The web site will only return a maximum of 500 records. This limit is avoided if the date range is just 8 days or less as suggested above in Step 5. If you select a longer date range (e.g. a month), the results may show 500. In that case, there is a good chance that there are more records than what is displayed. In that case, you will need to return to Step 5 and divide the chosen date range into multiple periods.
- Click the Data Grid symbol on the top. It is the second symbol to the right of Filter; it looks like a window pane.
- Click the filter (funnel symbol) option at the top of the Agency column.
You may have to scroll right to see it. - Enter J to select JPSO and eliminate entries from Algiers and Belle Chasse.
Then click the magnifying glass icon to apply. - Click the filter (funnel symbol) option at the top of the Address column.
- Enter NOT 70053 AND NOT 70058 AND NOT Harvey
Then click the magnifying glass icon to apply.
This will eliminate easily identified entries outside of Terrytown. Note that you can’t also exclude Gretna because some Terrytown entries show an address of Gretna 70056. - Click the word Class in the Class column. This will sort the crime incidents alphabetically.
- Manually count the number of incidents in each category. Note that only 50 incidents are displayed at a time on the screen. If there are more than 50, you will need to move to the next screen after counting the first one.
- Switch to the map view (click the Map symbol, the first one to the right of Filter) to identify and exclude any remaining incidents outside of Terrytown. Pay particular attention to incidents that lie on the border of just outside of Terrytown. The website indicates that “incident locations have been randomly offset at the request of the agency to protect victim privacy.”